


Understanding End-User Dashboard Needs and Wireframing Designs
Posted by | Fuld & Company
A global consumer goods conglomerate sells a wide variety of brands and products across 100+ markets. Since each end-market uses its own defined KPIs and 3P data sources, the company struggled to compare key KPIs across markets and apply learnings from one market to another.
Objective
To build a more centralized and streamlined end-market data reporting system and engage all stakeholders to understand their requirements.
Approach
- A team of data engineers and business/industry consultants reviewed the company’s current data systems, first-party data, end-market metrics, 3P data, and corresponding data definitions.
- On the basis of the company’s broad data and analysis needs, key stakeholders at different levels (leadership, management, analysts), in various business functions, and in the end, markets were identified.
- Several workshops and one-on-one interviews with identified stakeholders were held to discuss daily data and analysis needs, KPI definitions, current data and insight gaps, challenges, visualization preferences, etc.
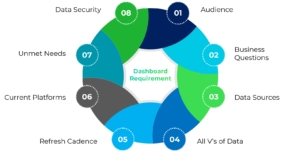
- Findings were summarized and inputs were shared (prioritized as P1, P2, and P3) for the dashboard wireframing and design phase.
- Translated learnings into design wireframes (using Figma), I design and UX best-practices were implemented, and design concepts were tested with the end-users.
Outcome
- Ensured high end-user acceptability when testing design wireframes, receiving only minor cosmetic feedback. This approach greatly reduced the required project execution time from concept design to deployment.
- The dashboards were deployed on time and clocked high engagement rates from all end-users.
Tools


Tags: Brand Strategy, case study, Consumer Products & Retail, Data analytics, Market Insights, Market Sizing