Employee Engagement and Satisfaction Dashboard
Posted by | Fuld & Company
A business services company conducted annual employee surveys to evaluate employee satisfaction, engagement, and recommendations to improve overall employment experience. After the survey deadline, they would spend four weeks analyzing the data and publishing results. The company wanted to reduce the turnaround time without compromising insights quality.
Objective
To leverage the survey data to better understand employees, automate subsequent result refreshes to achieve quicker turnarounds, and integrate survey findings with the learnings from annual appraisals.
Approach

- Reviewed sanitized employee responses from surveys and key performance indicators from appraisal summaries. The company helped map appraisals with employee responses through internal employee IDs, which were masked and shared.
- An automated data pipeline to ingest and normalize survey data was created. A star-schema model was developed to enable data trend reporting for KPIs such as NPS, CSAT, engagement, etc., and key learnings such as what was working or not.
- Appraisal summaries were leveraged (including self-appraisals) to identify employees’ overall performance, key professional development areas, training needs, and satisfaction and engagement data to identify well-performing and highly-engaged employees who might have concerns that need attention and immediate intervention. In the long run, these timely interventions ensured higher employee retention rates.

Outcome
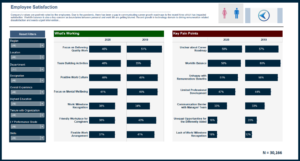
- Power BI dashboards were created to enable management to refresh, visualize, test, and validate survey results within two working days after survey deadlines.
- HR personnel were able to follow up with employees to better understand their issues and plan necessary interventions to improve employee satisfaction.
- A Power App was built for the HR team to compile details of its discussions with employees and close action items.
Tools
Tags: case study, Data analytics


